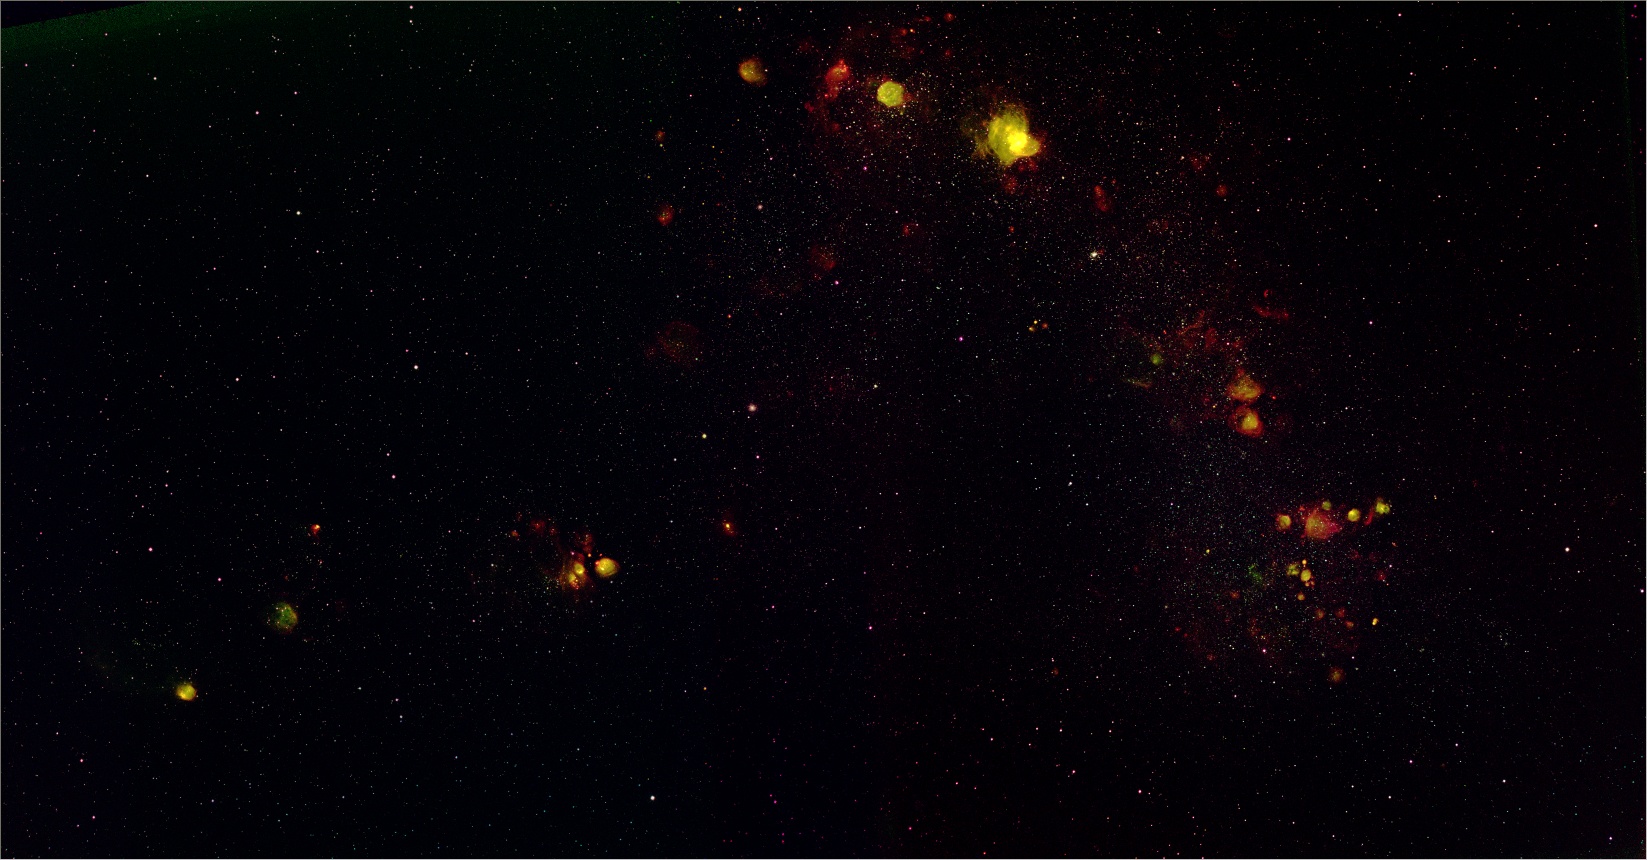
Mosaic image of the SMC in Hα (red), OIII (green) and SII (blue) with data from MCSF.
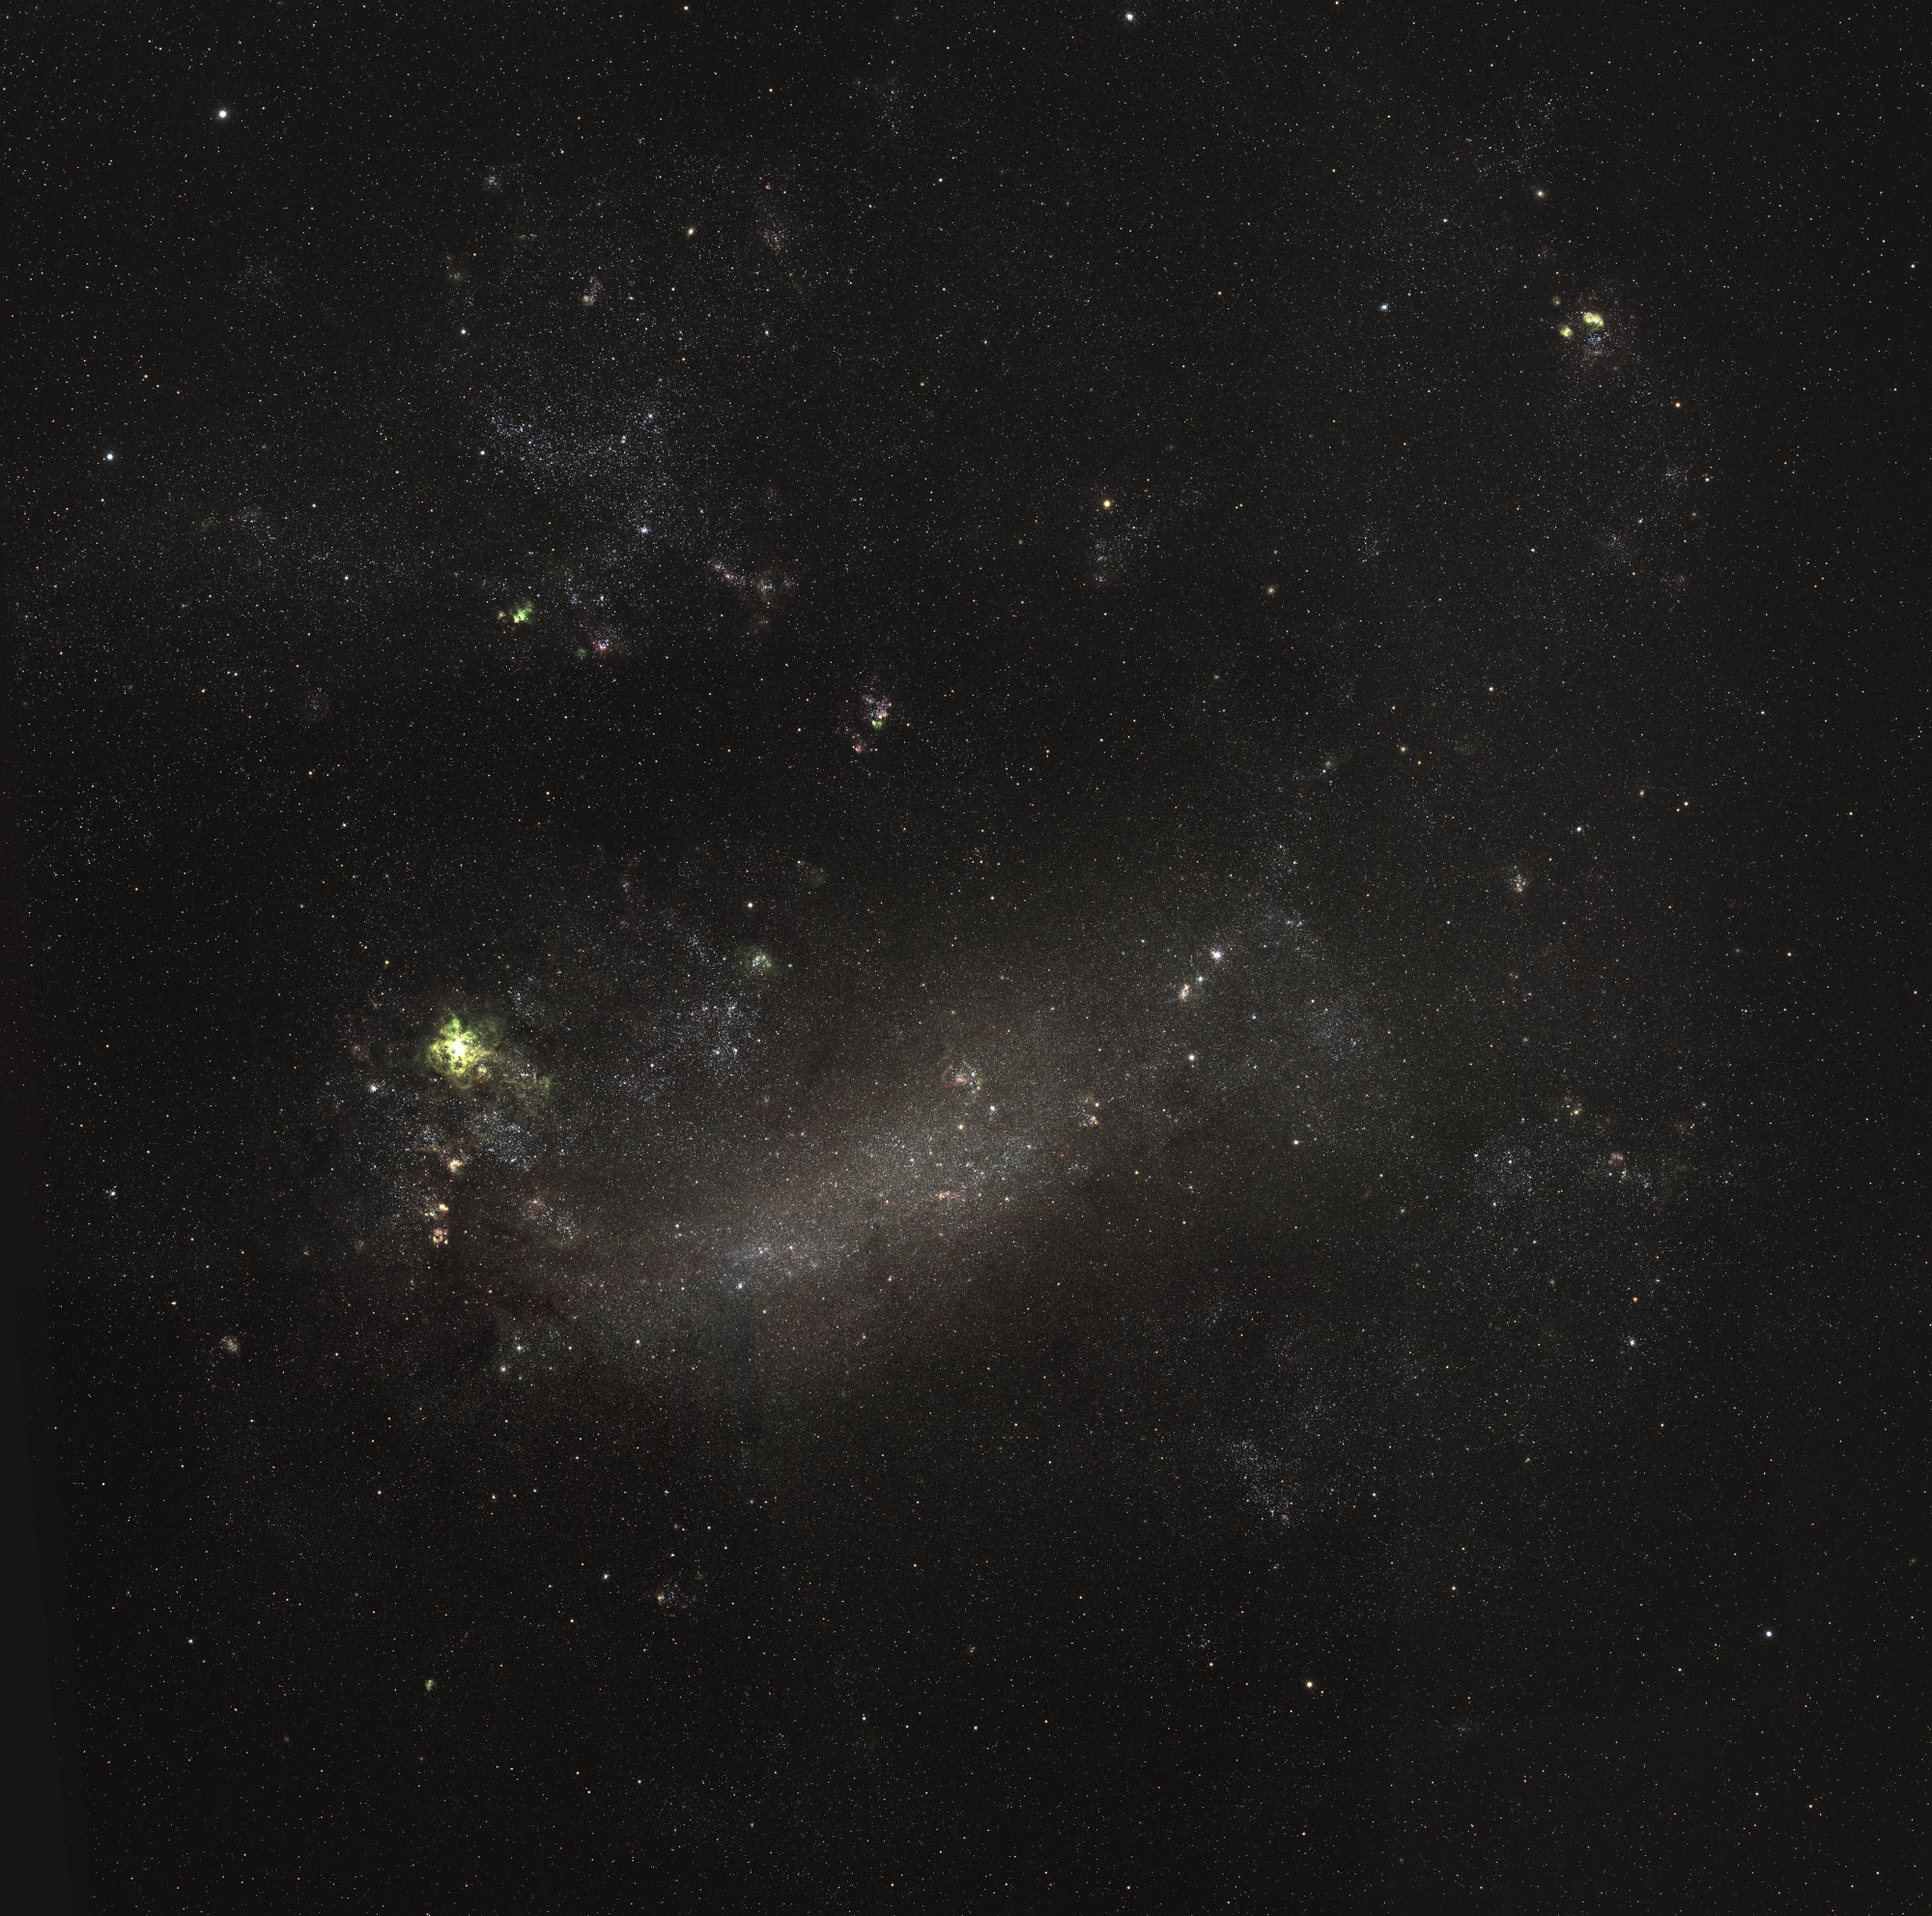
Mosaic image of the LMC in R+Hα (red), V+OIII (green) and B (blue) with data from MCSF.

Mosaic image of the LMC in Hα (red), R (green) and B (blue) with data from MCSF.